How hard is it for a first-time house hunter to succeed in the Golden State?
Well, five metros in California topped the list of the areas most out of reach: Los Angeles-Orange County, where homes were 12.1 times the median first-time buyer income, followed by San Diego (8.6), San Jose (7.9), San Francisco (7.4) and Sacramento (6.8).
NerdWallet’s third quarterly report analyzing affordability for first-time buyers shows no relief for those trying to squeeze into a market that continues to be characterized by unusually low inventory and an ongoing lack of “affordability.” Across the 50 most populous metro areas, the paltry number of homes hitting the market meant sellers could continue to price high in the third quarter, with no cooling-off period in sight.
Finding a home listed at three times their income — a long-standing gauge of home affordability — proved difficult once again for first-time buyers in the third quarter. Continuing the second-quarter trend, in the most populous metro areas, median list prices remained about 5.2 times first-time home buyer income in July through September.
Though 36% of home purchases in April were made by first-time buyers, that fell to a more typical 31% in September, according to the National Association of Realtors.
Though homes became more expensive across nearly all of the most populous metropolitan areas, Pittsburgh was most affordable — homes were typically listed at 3.3 times median first-time home buyer income in the third quarter. Then came St. Louis (3.3), Buffalo, New York (3.6), Hartford, Connecticut (3.6) and Cleveland (3.7).
This year’s super-low mortgage rates have been enticing enough to persuade well-qualified, experienced buyers to brave a highly competitive housing market, even in the midst of a pandemic. But for many first-time home buyers — who typically have less of a credit track record, smaller down payments and less flexible budgets — the third quarter of this year likely looked particularly daunting.
Rising prices
On average, U.S. list prices rose 3% in the summer quarter from teh spring.
Sellers generally list homes higher when the market heats up in spring and summer months. But home prices rose later than usual this year, due to the pandemic hitting right when traditional “homebuying season” would be getting underway.
Prices rose in 41 of the 50 metros analyzed, quarter-over-quarter, climbing the most in Philadelphia and Pittsburgh, where prices were 9% higher than in the second quarter. Prices in L.A.-O.C. and the Inland Empire rose 7%.
Nothing to buy
Not only are the homes available often listed at higher prices than many first-time buyers can stretch to spend, there are very few options available at all.
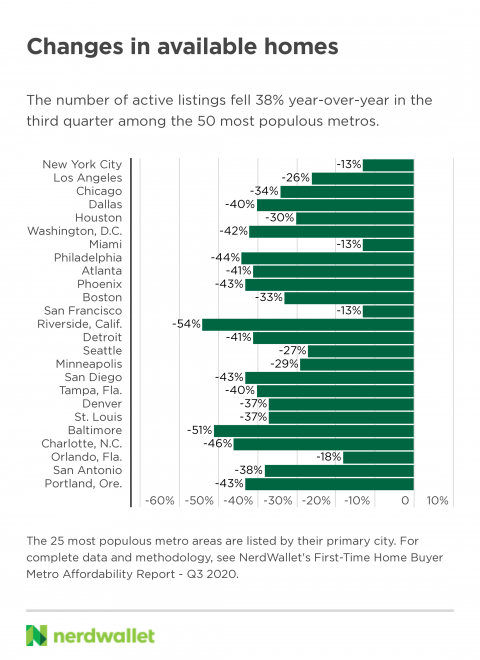
Active listings in the most populous metros were down 38% in the third quarter compared with last year at this time, and down 13% from last quarter.
Five U.S. metros saw list counts fall more than 50% from the third quarter of 2019 — 57% in Salt Lake City; 54% in the Inland Empire; 53% in Indianapolis; and 51% in Baltimore and Providence. Home shoppers in Riverside and San Bernardino counties are seeing roughly 7,230 listings to browse when they were seeing 15,670 last year at this time.
That makes L.A.-O.C. seem almost flush with homes to buy — its inventory is only down 26%.
Ordinarily, inventory across the country would begin a seasonal decline in October. But this year never saw the typical spring and summer influx of listings, and fewer and fewer homes are hitting the market as the year goes on.
Nationally, active listings fell 2% in the second quarter, and 14% in the third. Among the largest metros, supply fell 13% quarter-over-quarter.
This means sellers are having a heyday, and their homes are moving quickly from newly listed to sold. Metro area homes in the third quarter spent roughly six days less on the market than they did one year ago, and eight days less than in the second quarter.
Average days-on-market fell from 52 in the third quarter of 2019 to 46 this year’s third quarter among the largest metros. And a similar acceleration was seen nationally, where days-on-market fell from 62 to 56 year-over-year.
Posted by: https://anaheimsigns.com
No comments:
Post a Comment